Counting Cyclists
Looking into the proportion of cyclists currently using the CS9 route
I have noticed several comments recently along the lines of “cyclists are only 5% of road users”. For example:
https://hammersmithfulhamforum.com/2018/03/20/its-time-for-information-and-openness-on-cs9/
Makes the assertion that the CS9 consultation is “hugely biased”, as although 65% of respondents said they cycle, cyclists are only 5% of road users. This is illogical, as it is perfectly possible for lots of people to be occasional cyclists—indeed these might benefit most from CS9 allowing them to cycle more easily. However, I was interested in the figure of cyclists being only 5% of road users. As I cycle frequently on the Hammersmith stretch of the A315, this figure seemed low, particularly for rush hour where dozens of cyclists seem to accumulate at traffic lights. So I wondered about the source of this statistic, which was not given.
As far as I can see there are several possible sources for this number. One is the 2014 LBHF Borough Profile:
In section 10.9 this says that 4-5% of residents use a bicycle on an average weekday. That’s a similar number to quoted above, but not the same statistic. The other potentially relevant statistic in here is that 7.4% of commutes by residents are by bike (compare this to 12.8% by car—not so different as many people imply). These figures are now four years out of date.
A better source would be the 2016 Department for Transport traffic estimates, published here:
https://www.dft.gov.uk/traffic-counts/cp.php?la=Hammersmith+and+Fulham
Looking at the percentage of cycle counts across all LBHF data for 2016 gives just 1.6% cyclists. Of course these borough-wide counts include major trunk roads where it is extremely unattractive or illegal to cycle that have no or very few cyclists. When the A4, A40, M41 and A3220 are excluded from the counts, the figure is 6.1% cyclists based on direct counts, and 7.4% including estimates (where a direct 2016 count was not available), so slightly higher than the 5% quoted. These counts are average annual daily flows.
However, a more relevant statistic pertaining to the CS9 consultation would be the counts along the A315. These street-level data are available, so I downloaded the data for the A315 count points. Below I have plotted the traffic flows over time, as there are no manual counts in the DfT data for these locations since 2011.
Number of bikes as a percentage of all motor vehicles and bikes:
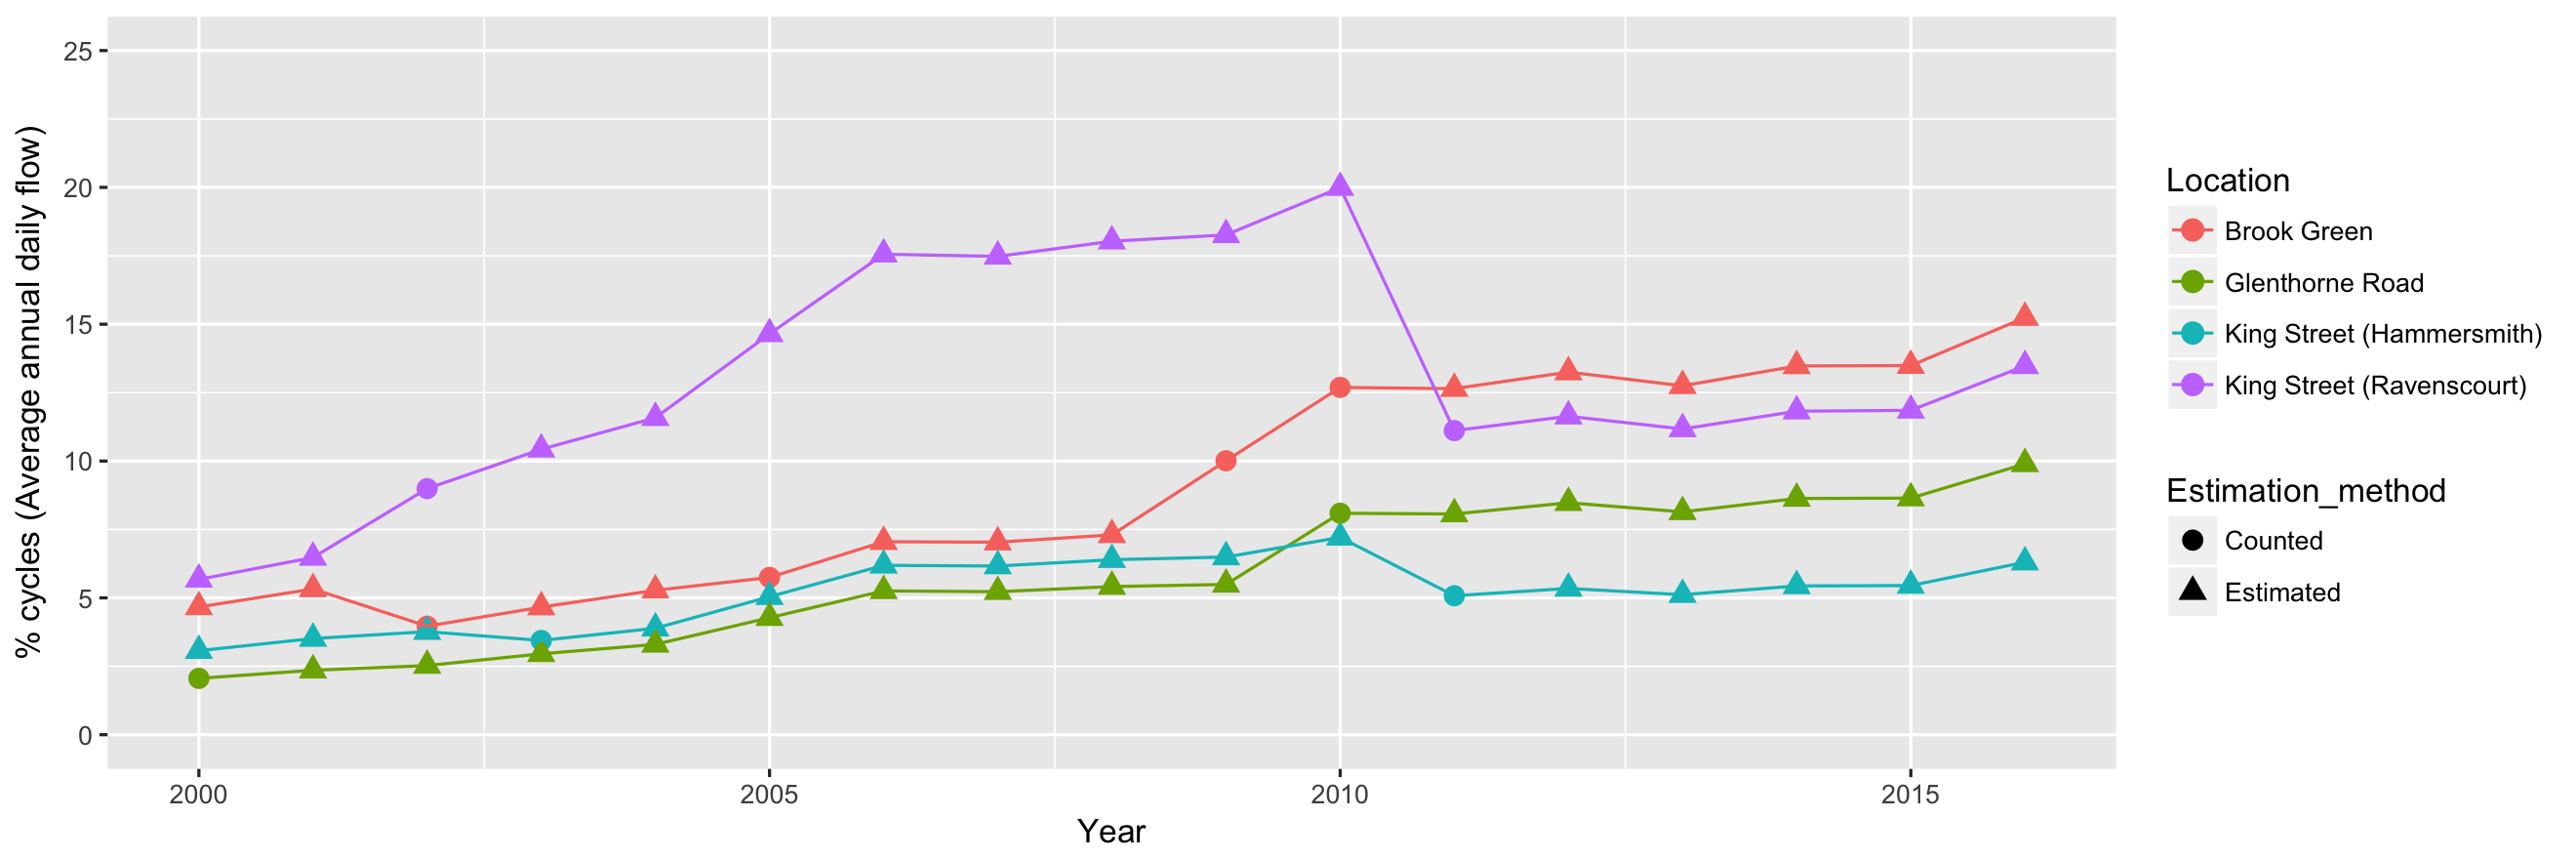
The large peak (for King Street near Ravenscourt Park) seems to be caused by the long period of estimated readings proving inaccurate when a count was undertaken. We can also look at the data using just the actual counts rather than the estimates.
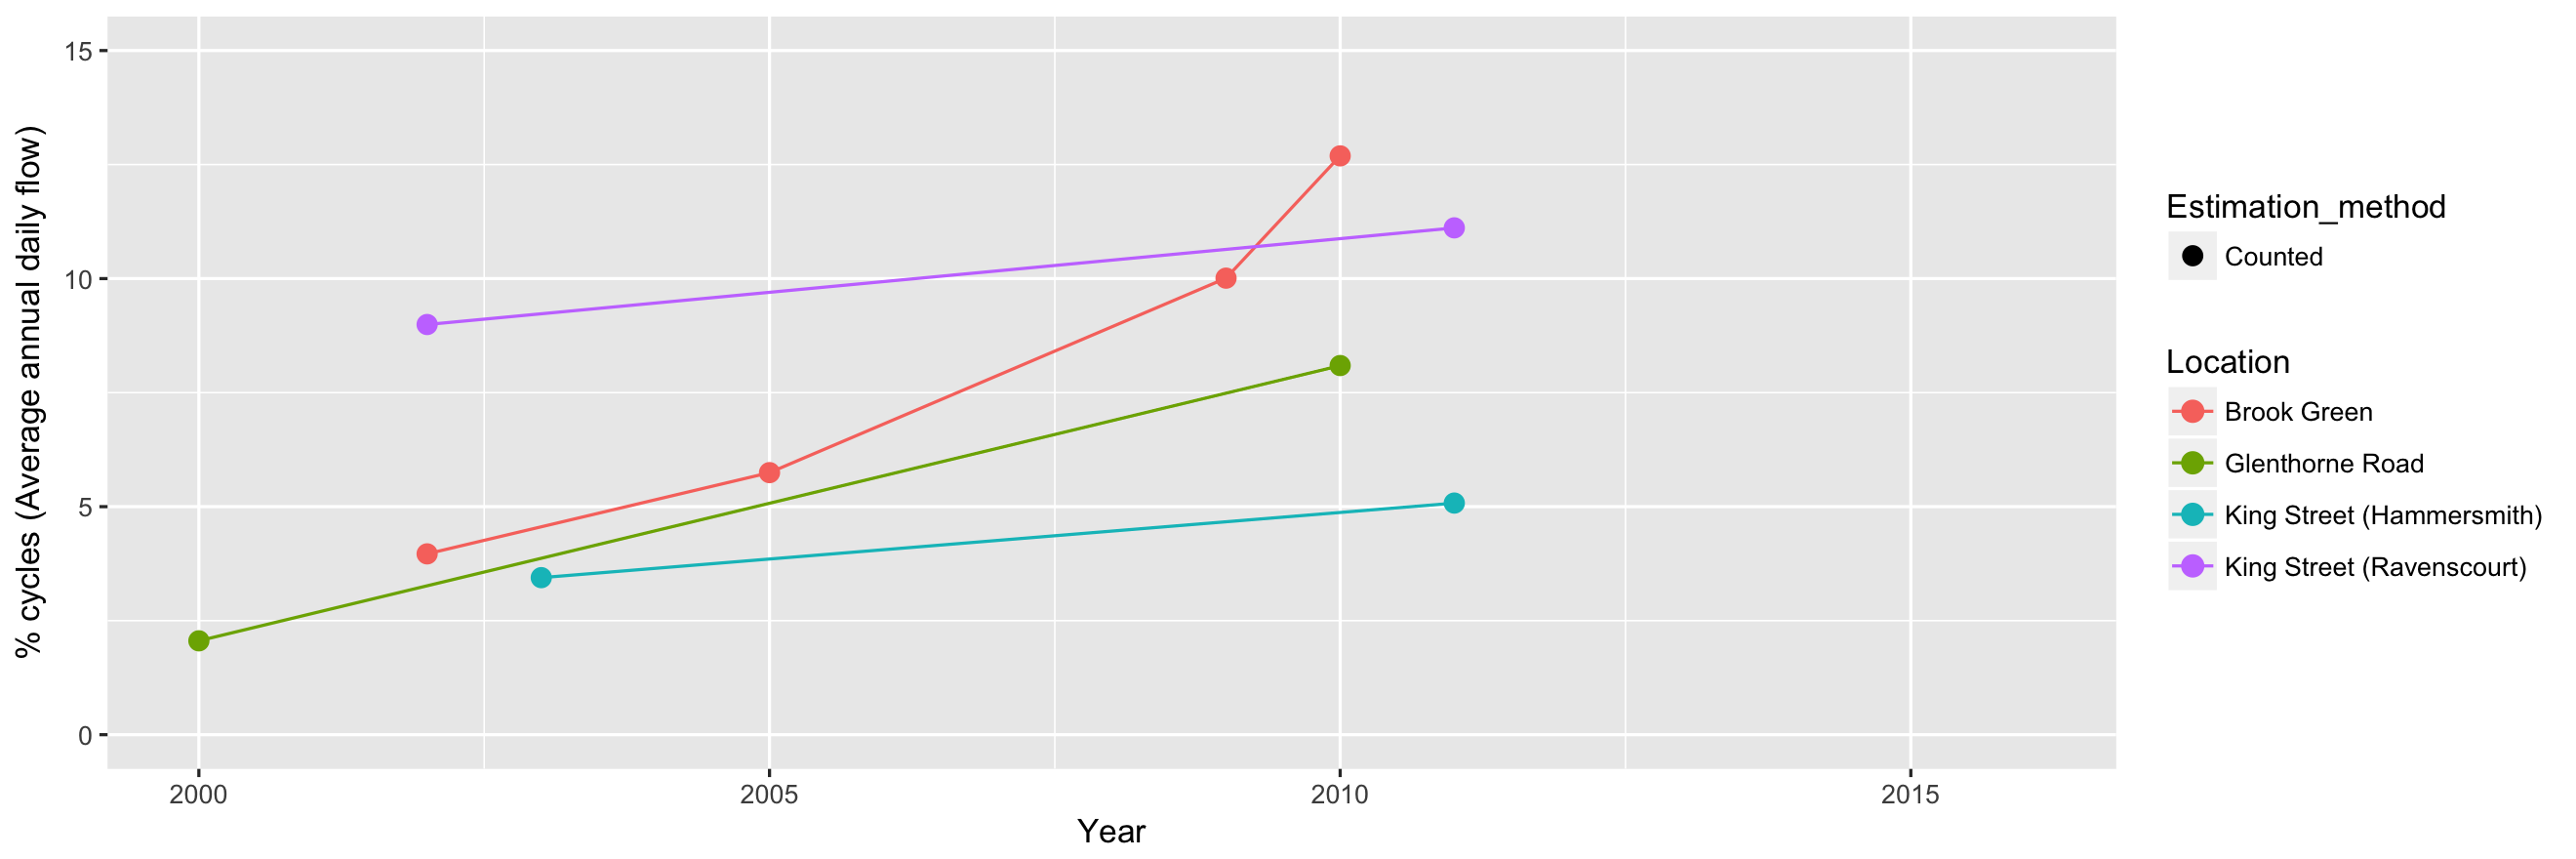
So the estimated 2016 figures, as well as the last available manual counts in 2010/2011 were all above 5% for the A315 in Hammersmith, and in some cases substantially so. The highest figure in fact is for the Avonmore & Brook Green section of the route, where the 2010 count was already 12.5%, which is likely to have increased since given the generally higher levels of cycling. The Ravenscourt figure is also greater than 10%. The other two locations are part of the one way system leading to and from the Gyratory so perhaps are not typical, yet still have at least 5% cyclists.
It’s a shame that more recent count data are not available for the route; however it’s clear that the numbers of cyclists compared to other motor vehicles along the route are higher than the 5% figure being used to suggest cyclists are an ignorable minority. These are average daily counts, so at rush hour the proportions could be substantially higher, consistent with my anecdotal experience.
I’m still not sure if this is really the revelant statistic is however. It ignores several other factors, for example:
- Most “road users” are in fact pedestrians and completely ignored by these statistics. Making streets pleasant places to be through schemes such as CS9 benefits them. If we are going to design streets around the most numerous users, pedestrians should be prioritised, and certainly not cars.
- The LBHF Profile above shows that just under half of households in the borough have access to a car. 56% of respondents to the consultation report traveling by car locally and 65% by bike. So there must be a substantial number of people (including me) who both drive and cycle, as there will be plenty that do neither. These people may also support better cycling infrastruture.
- The “build it and they will come” factor. Car ownership is falling, but cycling is more affordable and accessible for many. Elsewhere in London, buiding protected cycle routes has led to large increases in use, and along the central routes, cyclists make up 46% of peak traffic, taking up only 30% of the road space: https://www.london.gov.uk/sites/default/files/londons_cycling_infrastructure.pdf. If this pattern is repeated here, it is likely that the proportion of cyclists on the route will increase once it is built.